
How to Measure Vision AI ROI in Manufacturing: A Practical Framework
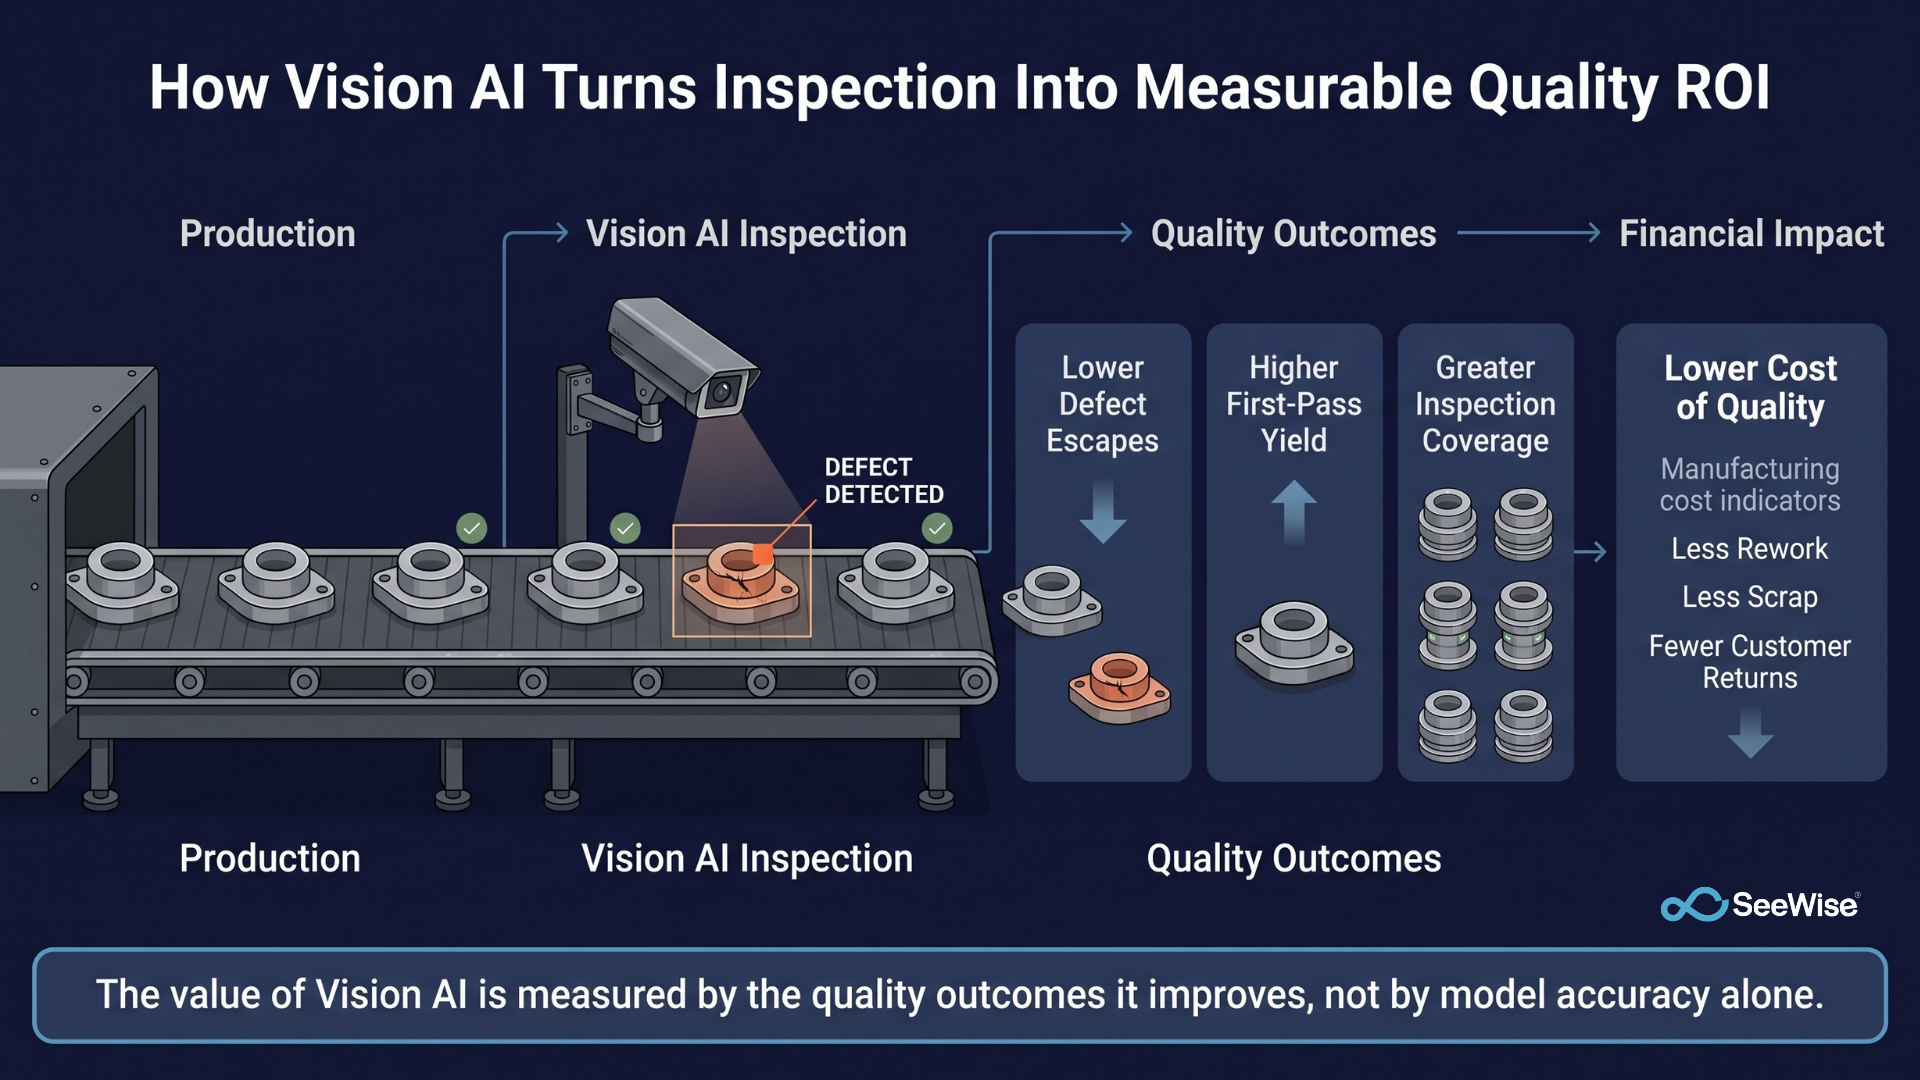
A vision inspection system can achieve 95% accuracy in testing and still fail to improve your plant's actual quality numbers. This happens when the system is evaluated around a model metric instead of an operational outcome.
Accuracy tells you how well a model performs against a labeled dataset. It does not tell you whether defect escapes decreased, whether customers are receiving fewer bad parts, or whether the investment paid for itself.
If you are a plant manager or QA head who has deployed Vision AI, or you are building the business case for leadership, you need a way to measure ROI that both finance and operations can trust. That means connecting model performance to the metrics your plant already tracks, such as defect escape rate, first-pass yield, OEE, downtime, and cost of quality.
A practical approach is to measure Vision AI ROI across three layers: quality, productivity, and safety, supported by both leading and lagging indicators.
Layer 1: Quality, The Foundation of Vision AI ROI
Quality should be the starting point for measuring Vision AI ROI because it has the clearest connection between what the system does and what the business cares about: fewer defects reaching customers, less rework, and lower scrap.
Defect Escape Rate
For quality-focused Vision AI deployments, defect escape rate is one of the most important outcome metrics to track. It measures defects that pass inspection and reach the next production stage or the customer.
This is different from detection accuracy, which measures model performance on a test set. Escape rate measures what actually happened on the production line.
A sustained reduction in escape rate can indicate that inspection coverage and detection effectiveness have improved.
First-Pass Yield
First-pass yield measures the percentage of parts that pass inspection without requiring rework.
If first-pass yield improves after deployment, it can indicate that defects are being identified earlier, before they create additional downstream costs.
Inspection Coverage
Inspection coverage matters because many manual inspection processes rely on sampling rather than checking every part.
Vision AI can increase the percentage of production that is inspected. That increase alone can lead to more defects being identified, so coverage should be tracked alongside defect counts. Otherwise, it becomes difficult to determine whether more defects were found because the system performed better or simply because more parts were inspected.
For more examples of how Vision AI is applied across manufacturing operations, explore Vision AI use cases in factories.
Cost of Quality
Cost of quality connects these operational improvements to financial impact. Track changes in rework costs, scrap, customer returns, warranty claims, and other quality-related expenses before and after deployment.
Before deployment, establish a baseline using at least 3 to 6 months of historical data where available. Without a baseline, post-deployment numbers have no reliable point of comparison.
Layer 2: Productivity, The Efficiency Layer
Once quality outcomes are being measured, productivity metrics help show whether Vision AI is improving the efficiency of the operation.
OEE Improvement
Overall Equipment Effectiveness, or OEE, combines availability, performance, and quality to measure equipment effectiveness.
Vision AI can contribute to OEE improvement by identifying quality or process issues earlier and helping teams respond before they result in larger production losses. However, OEE changes should be evaluated alongside other operational changes to avoid attributing every improvement to Vision AI.
Downtime Reduction
Track unplanned downtime before and after deployment. Where the system identifies conditions that allow teams to intervene before a stoppage, compare the resulting downtime with the established baseline.
Across Seewise deployments, more than 42,000 hours of downtime have been reduced by surfacing issues earlier.
Inspection Hours Saved
Measure the hours previously spent on repetitive manual inspection and how those hours are reallocated after deployment.
This should be reported as hours reallocated rather than simply as headcount eliminated. In many manufacturing environments, employees are moved to higher-value activities rather than removed from the workforce.
Layer 3: Safety, The Risk Reduction Layer
Safety metrics provide another way to quantify the value of Vision AI, particularly for deployments focused on PPE compliance, unsafe behavior, or hazardous conditions.
PPE Compliance
Track the percentage of observed instances where required PPE is correctly used compared with violations. PPE compliance can serve as a leading indicator of safety performance.
Near-Miss Detection
Measure how many potential safety incidents are detected before they escalate. This helps demonstrate whether the system is identifying risks that may otherwise go unnoticed.
Incident Frequency
Compare recordable incidents before and after deployment. Across Seewise deployments, more than 22,000 safety incidents have been identified across customer sites.
Safety improvements should still be evaluated carefully because changes in training, procedures, staffing, or reporting practices can also affect incident numbers.
Leading vs. Lagging Indicators
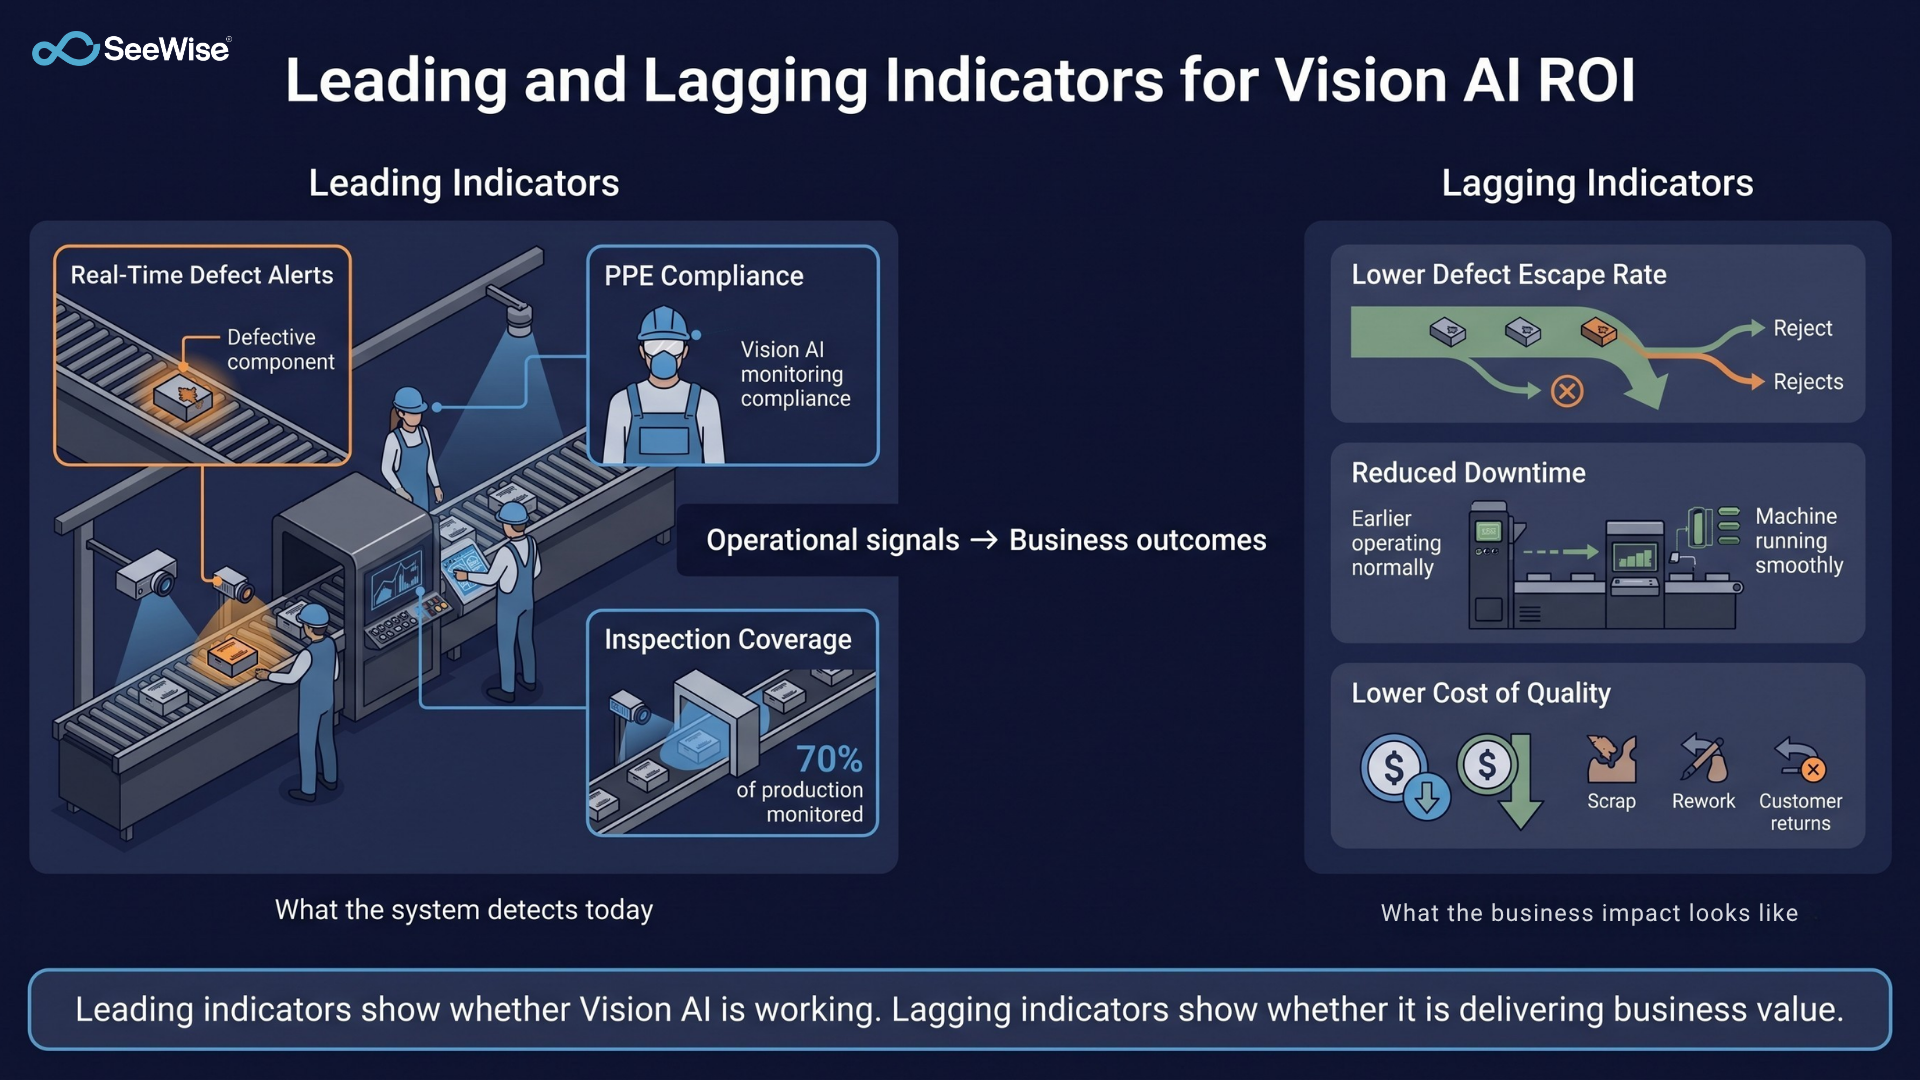
Measuring only final outcomes can make it difficult to identify problems with a deployment early. A strong ROI framework uses both leading and lagging indicators.
Leading indicators show whether the system is actively working and identifying issues. Examples include PPE compliance, near-miss alerts, inspection coverage, and real-time defect flags.
Lagging indicators show whether those activities translated into business outcomes. Examples include customer returns, defect escape rate, recordable incidents, scrap costs, and downtime costs.
Leading indicators can be reviewed weekly to identify deployment issues. For example, a sudden drop in defect alerts could indicate a camera or system issue rather than an actual improvement in quality.
Lagging indicators can be reviewed monthly or quarterly to demonstrate business impact to leadership.
How to Present Vision AI ROI to Leadership
Once the numbers are available, the way they are presented matters.
Connect metrics to financial impact. Translate defect escapes into return, rework, warranty, or complaint costs. Translate downtime reduction into the cost of an hour of production loss. Make the financial impact visible instead of expecting finance teams to calculate it themselves.
Show baseline versus post-deployment results. A post-deployment number on its own does not prove improvement. Show the starting point, the current result, and the change between them.
Attribute improvements conservatively. If first-pass yield improved after a supplier change, operator training, or process modification as well as the Vision AI deployment, acknowledge those factors. A modest, well-supported ROI figure is more credible than an inflated claim that cannot withstand scrutiny.
Before You Measure ROI, Prepare for Deployment
Measuring ROI starts before the Vision AI system goes live. Establishing a baseline is only one part of manufacturing AI readiness. Teams should also align on the KPIs being measured, define workflows for responding to alerts, and establish ownership for monitoring results.
This preparation makes it easier to compare pre-deployment and post-deployment performance and determine whether the system is actually delivering business value.
From Model Performance to Business Value
Vision AI ROI is measurable, but only when measurement is built into the deployment from the beginning.
Start with a quality baseline, then track productivity and safety outcomes using a deliberate mix of leading and lagging indicators. Most importantly, connect each improvement to a financial outcome that leadership can understand.
The goal is not to prove that an AI model works. The goal is to prove that it improves the operation.
Across Seewise deployments, systems have flagged more than 117,000 parts with defects, identified more than 22,000 safety incidents, and reduced more than 42,000 hours of downtime. These outcomes provide a practical starting point for understanding how Vision AI can translate detection into measurable manufacturing impact.
If you are evaluating Vision AI for your plant, the right question is not simply, "How accurate is the model?" It is, "What measurable business outcome will this system improve, and how will we prove it?"

How to Measure Vision AI ROI in Manufacturing: A Practical Framework